
On the Map
Rebecca Lucas, Collections Officer
Finding the Stories Told By Maps
Maps can tell us much more than how to get from A to B. They hold vast amounts of information. By delving deeper into this information and the reasons for their creation we can discover many stories waiting to be told.
Maps have always been used to make sense of and bring order to the world around us. They help us understand not just where we are, but also who we are. Maps tell stories of war and conflict, power and control, our changing landscape, and our priorities and identities.
Map Making
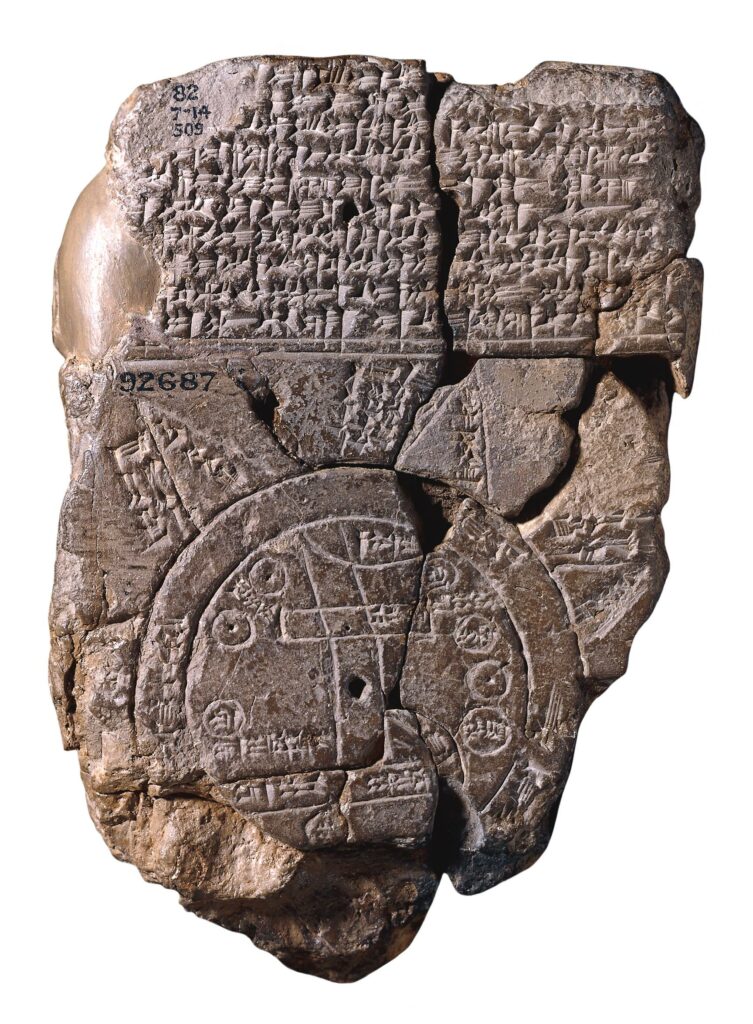
Humans have used maps to represent, navigate, and understand the world around them for thousands of years. The oldest known map of the world dates from the 6th Century BCE. It shows the world as the Babylonians understood it. It is a clay tablet with an engraving that shows the world as a disc surrounded by water. The river Euphrates runs through the middle and the circles represent cities.
Maps have not always been an accurate representation of the topography of the world. They have been used to understand the world or send a message. In Europe during the medieval period, many maps were symbolic. These maps were works of art that showed stories and places from the Bible and represented the power of God.

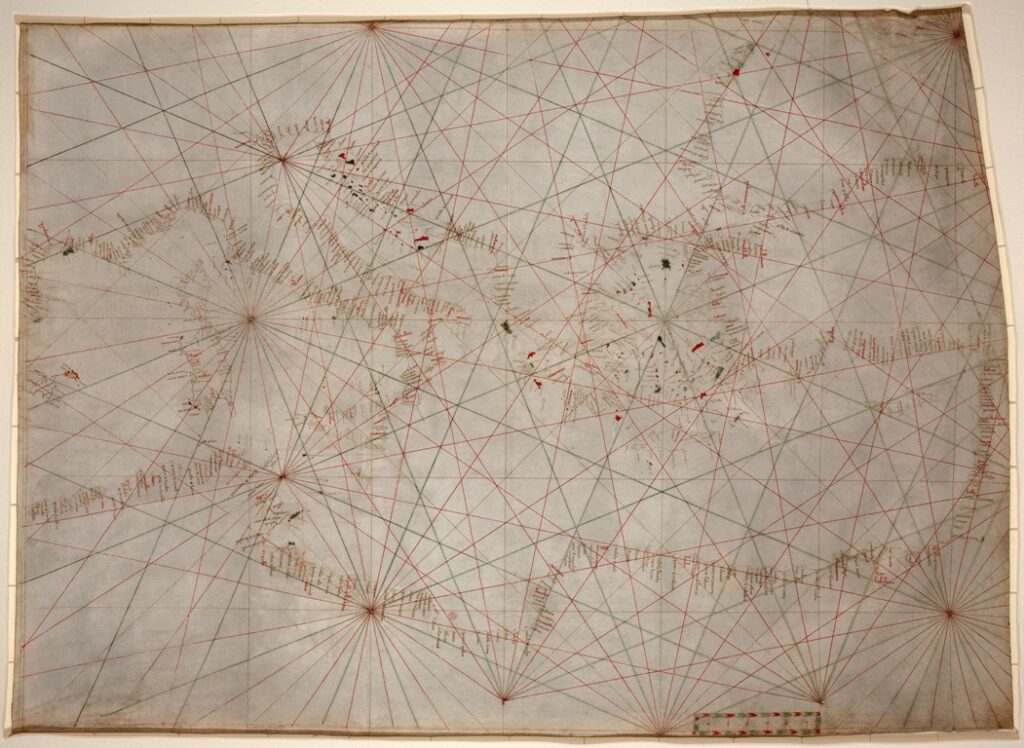
As Europeans explored and colonised the world they needed maps for navigation. At the same time, improved scientific understanding meant they could measure the world more accurately.
Methods and tools for mapping have continued to improve. Modern map making uses computer and satellite technology.
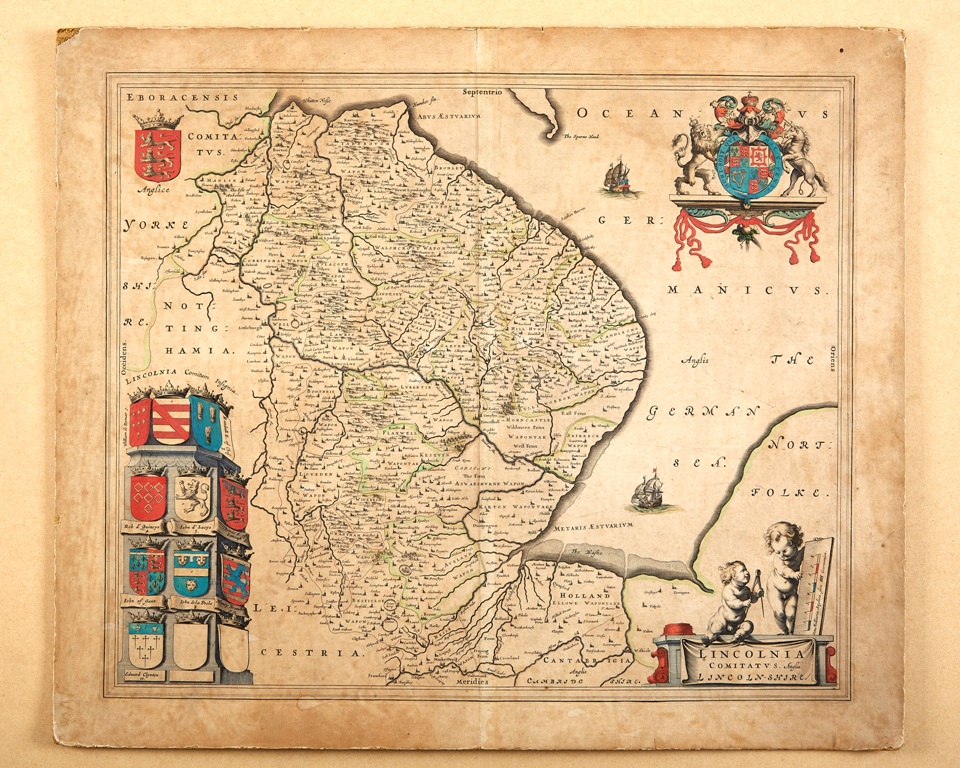
Elizabethan County Maps
These maps are of the county of Lincolnshire and were all drawn in the 16th and 17th Centuries. They tell us a story of power and advances in surveying.
The Elizabethan period (1558-1603) was a time of increased central government control over the country. Understanding all the regions of Britain was important to maintain this power.
William Cecil, 1st Baron Burghley, was chief advisor to Queen Elizabeth I. He recognised the military and political power of maps. In 1574 he commissioned Christopher Saxton to produce a survey of every county in England and Wales. This was completed in 1578.

Significant advances in surveying technology made the Saxton maps the most accurate and detailed of the time. William Cecil annotated the proof copies of Saxton’s maps with notes useful for defence and governance. He had them bound into his ‘Atlas of the Counties of England and Wales’.
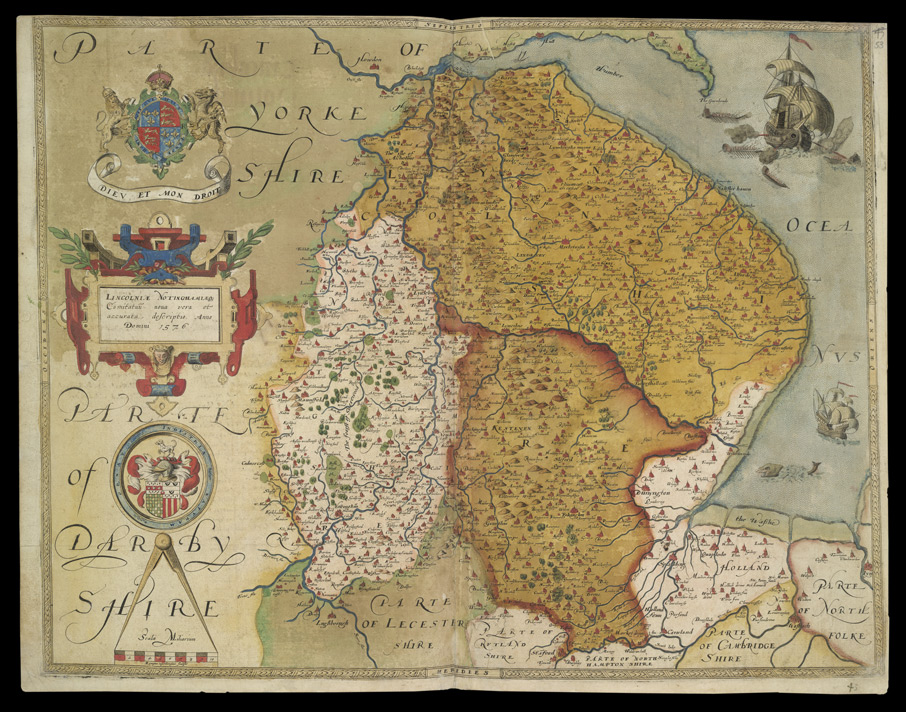
Improved printing technology meant maps were no longer one-off pieces of art. They could be reproduced and viewed by a large audience. Maps were becoming a part of everyday life. Saxton’s maps were updated and reissued until c.1778. They set the standard for cartography and formed the basis of all succeeding county maps until after 1750.
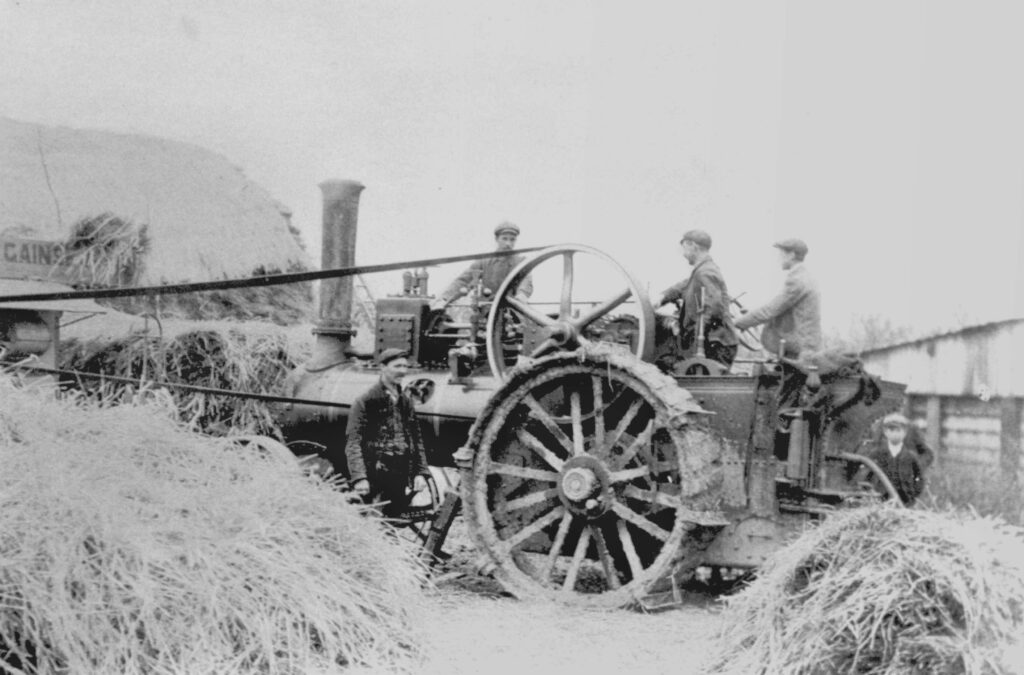
Changing Landscapes
The landscape of North Lincolnshire has been shaped by the people who lived and worked in it. Maps tell the stories of our evolving landscape and the influences behind these changes.
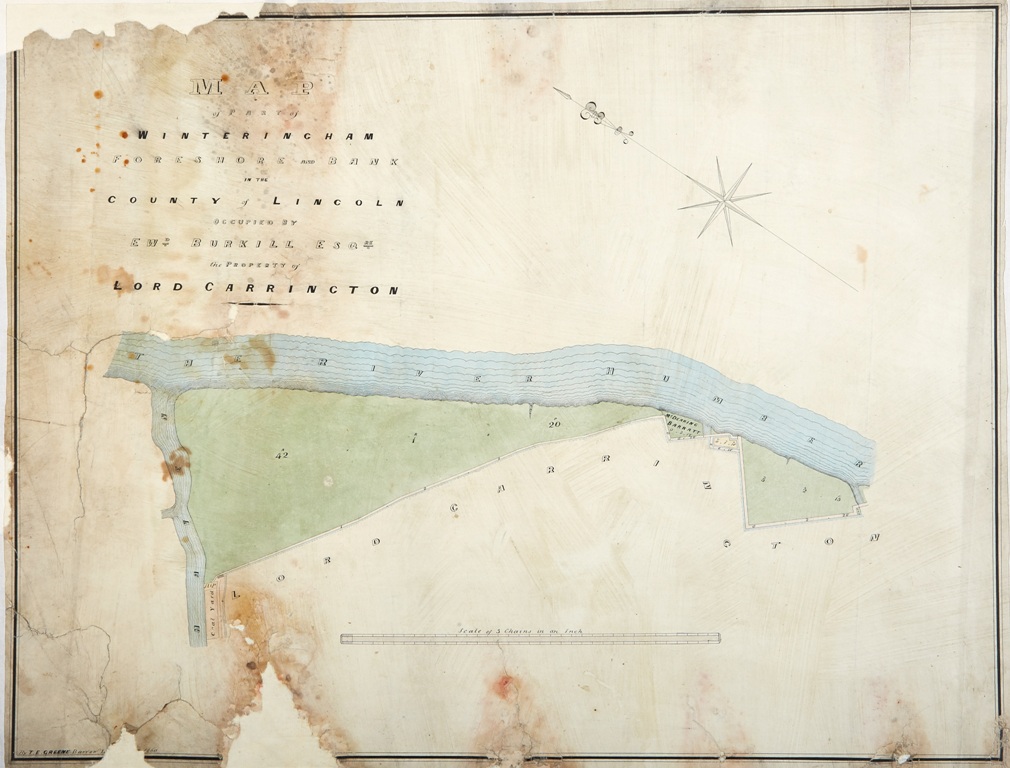
Estate maps will often show how the land was farmed and who by. By comparing maps from different eras, we can see the changes in land use, ownership, and farming practices.
Land drainage is an important part of this area’s history. Maps were used to plan drainage programmes and can show us how the landscape changed. The Isle of Axholme used to be a marshy, wet landscape. The area was famously drained by Cornelius Vermuyden in 1626. This and later drainage schemes drastically changed the landscape.
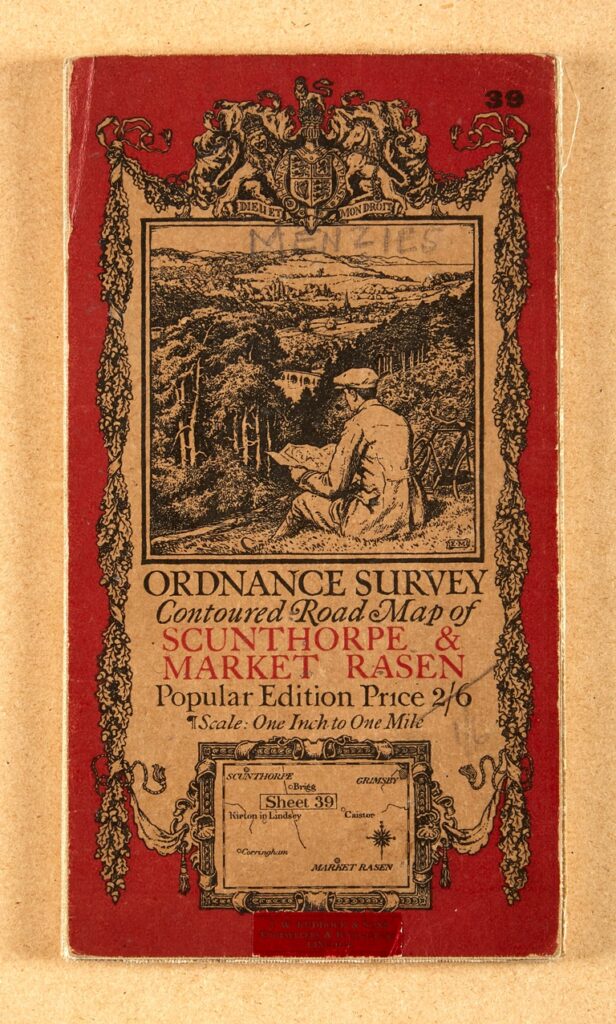
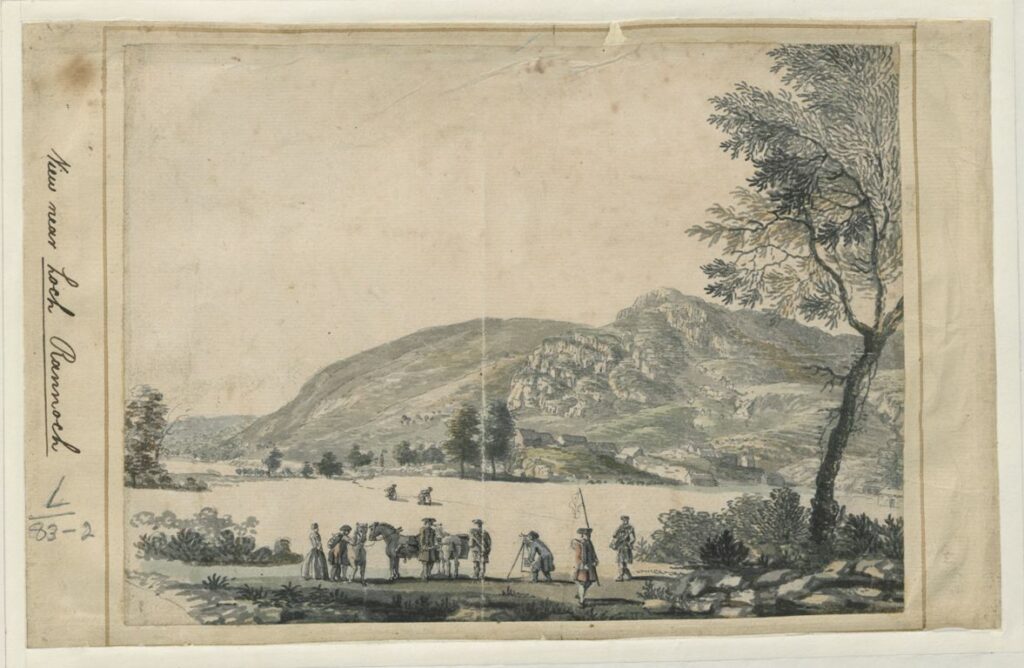
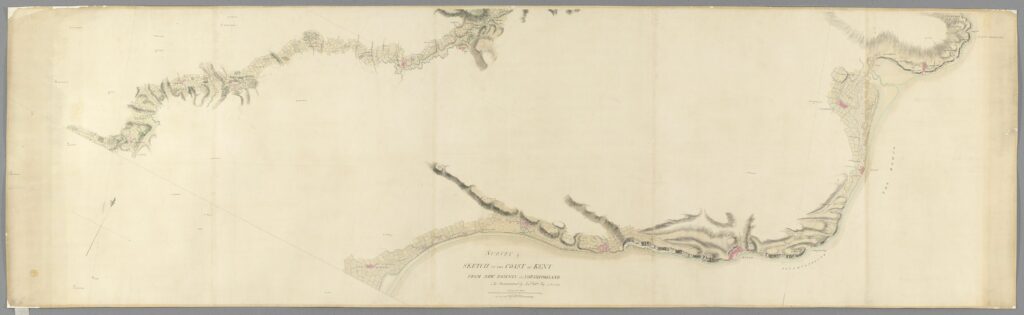
Military Mapping
The history of mapping and the military are closely connected. An understanding of the land and accurate navigation are key to military success.
The founding of the Ordnance Survey is rooted in the military. The Jacobite Rising of 1745 prompted the military survey of Scotland. The south coast of England was mapped in response to the threat from France. Before these first surveys, maps lacked the detail needed for planning military manoeuvres. The Ordnance Survey was established in 1791 and continued to provide a military service. During the First World War the organisation produced 342 million maps for the war effort.
Controlling geographic data is a key part of defence. During the Second World War road signs were removed so an invading force would struggle to find their way. Sensitive information is often omitted from maps during wartime. Even during peace time, top secret locations do not always appear on publicly available maps.
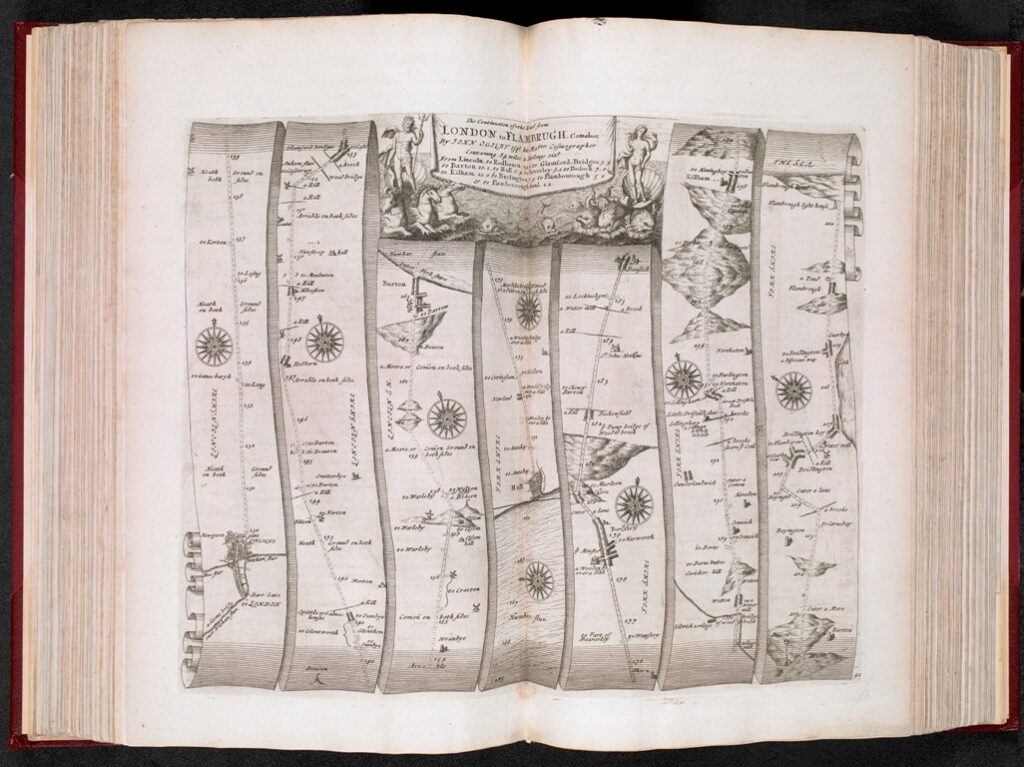
Transport
Maps help travellers find their way. Increases in the efficiency and variety of transport also increased the use and availability of maps. The first British road atlas was published by John Ogilby in 1675. Ogilby’s Britannia Atlas showed journeys between towns in strips.
The railway boom of the 19th Century was also a mapping boom. Maps were vital to the planning, approval, and development of railways. Railway companies used maps in timetables and to advertise the extent of their network.
The London Underground Tube map is famous for its schematic design. It shows the lines and stations in relation to each other rather than their actual positions. This method is widely used for transport maps making them easy to use.
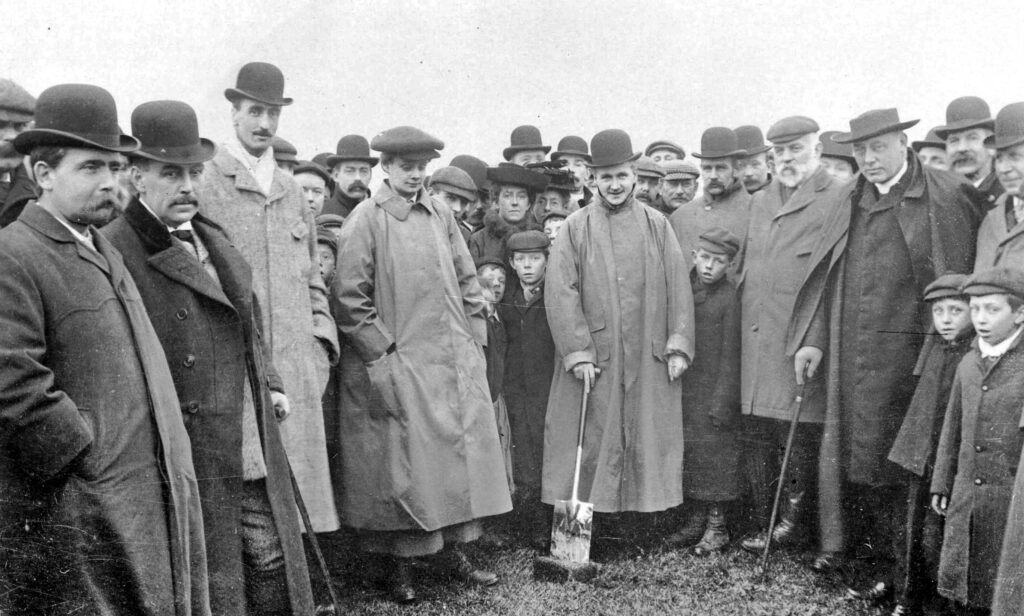
Leisure
During the 19th and 20th Centuries maps became an increasing part of everyday life. Before, they were mainly used in a military, planning or governance capacity. But ordinary people now had increasing access to public transport, cars, and bicycles. This meant they could explore the world around them.
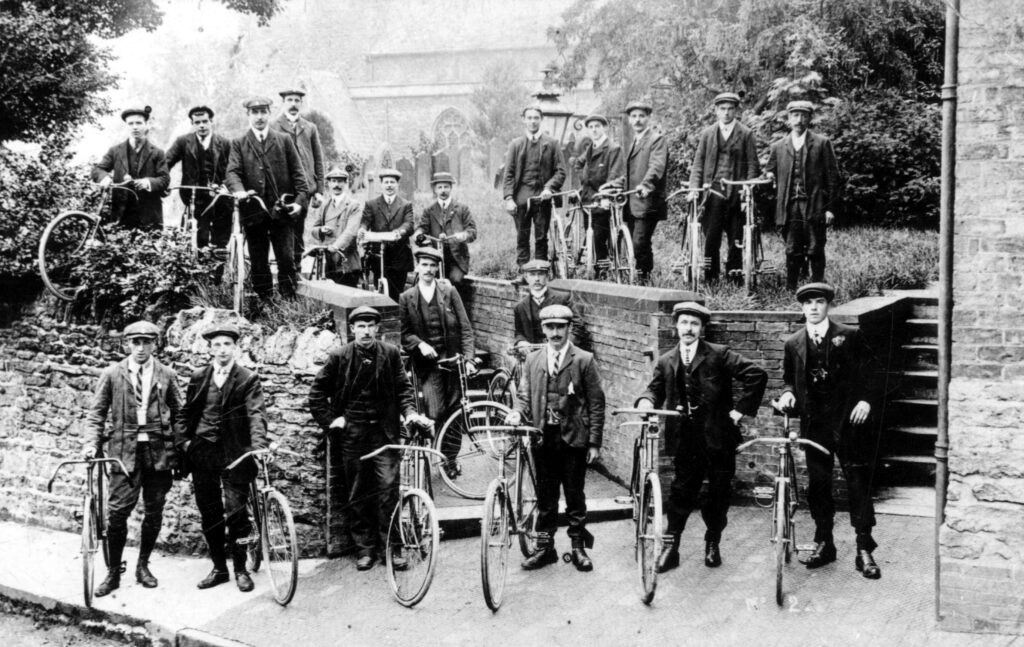
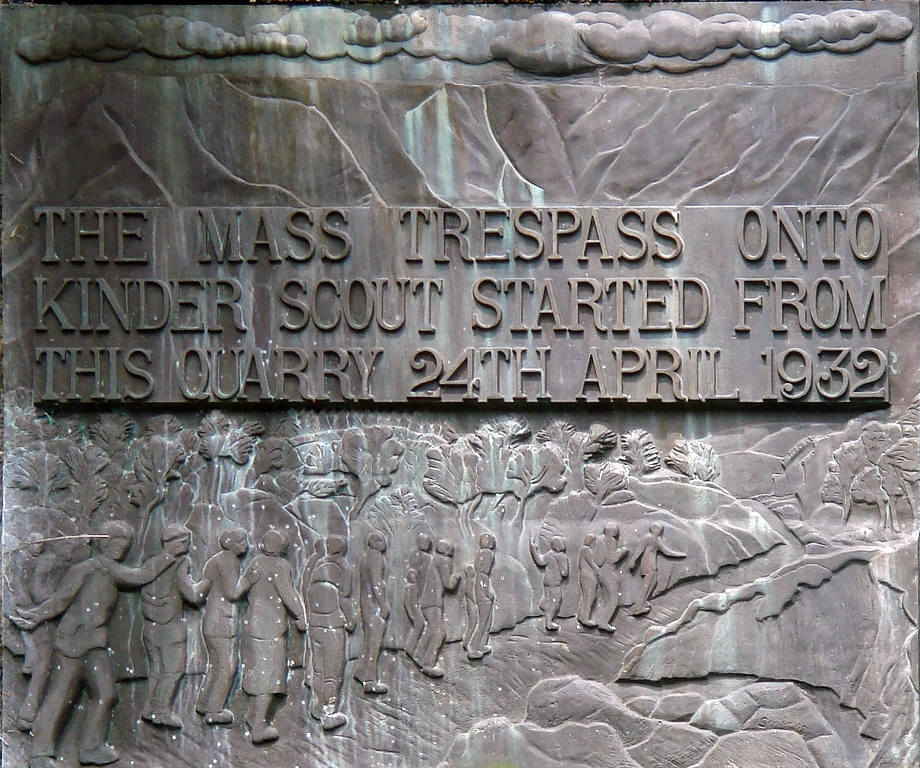
Working people had more free time and disposable income. They had time for leisure activities and travel. The 1932 mass trespass onto Kinder Scout was a protest against restricted access to the countryside. Demands for public access to the countryside led to the creation of National Parks in 1949. With more of the countryside to open to them, people used maps to explore it.
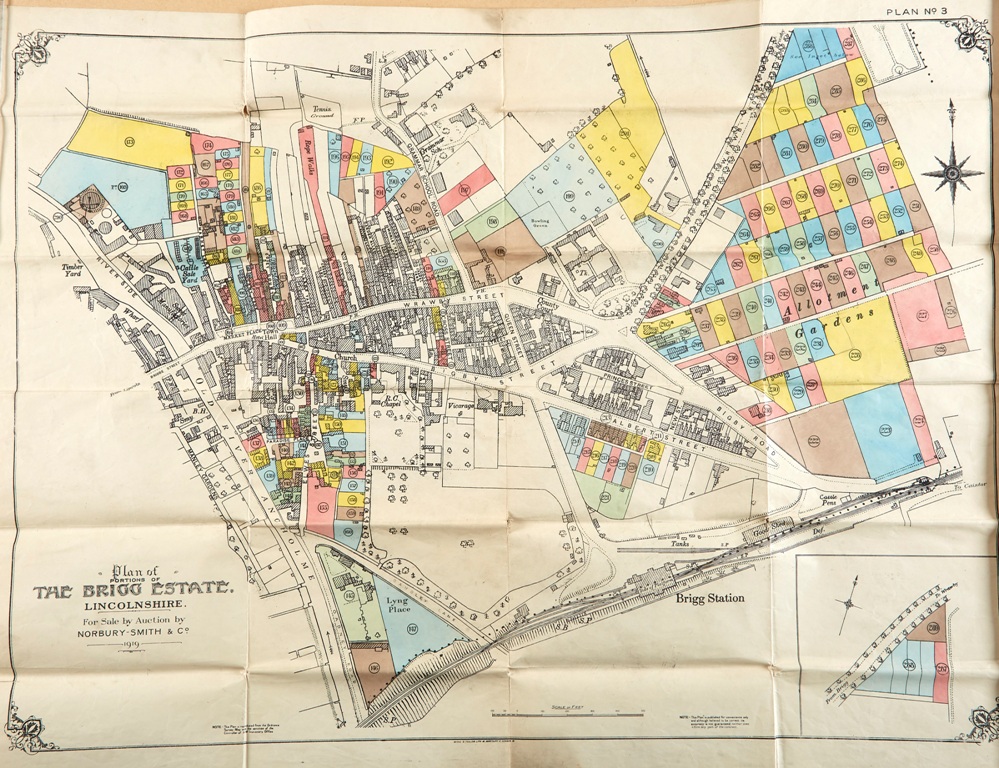
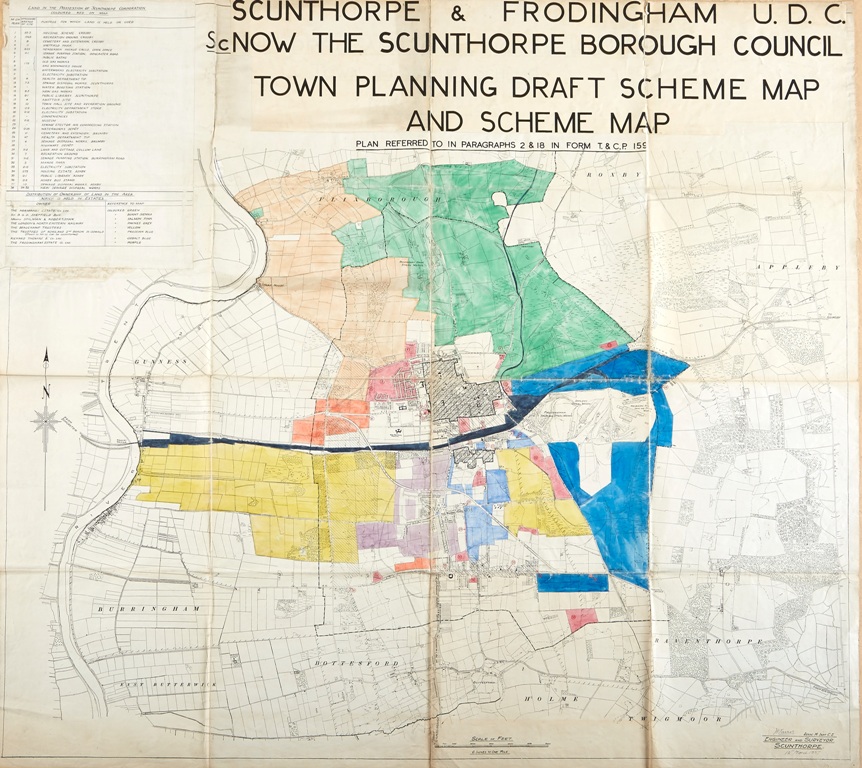
Town Planning and Governance
Maps can tell the story of the creation and development of our built environment. Maps are often used to plan where to build certain things such as homes, shops, and schools.
Due to the boom of the steel industry, Scunthorpe expanded very quickly. This meant it did not grow and evolve over time but was carefully planned using maps. Houses were planned to be within easy reach of shops and schools. Green spaces such as parks were set aside to create a pleasant environment. This kind of planning can also be seen on maps of many North Lincolnshire towns, on a smaller scale.
Maps are also used in administration and governance. Lines drawn on maps marking political boundaries can have wide reaching impacts. County boundaries are often changed and redrawn, including the creation of Humberside in 1974 and its abolition in 1996. Constituency boundaries can have an impact on who wins an election.
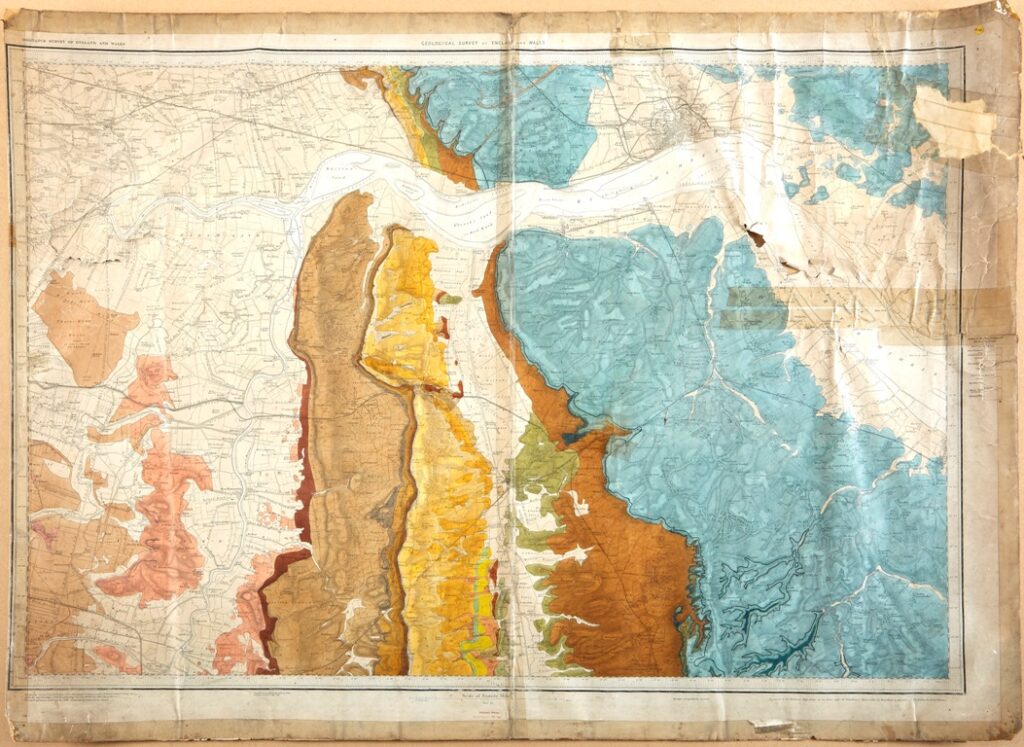
Geological Maps
Geological maps show us the world beneath our feet and tell the history of the earth.
By using colours and symbols these maps show us the types of rocks that make up the Earth. By identifying the fossils found in the different types of rocks we can work out how old the rock is. For this reason, geological maps are maps of time as well as space. They tell us about the past as well as Earth now.
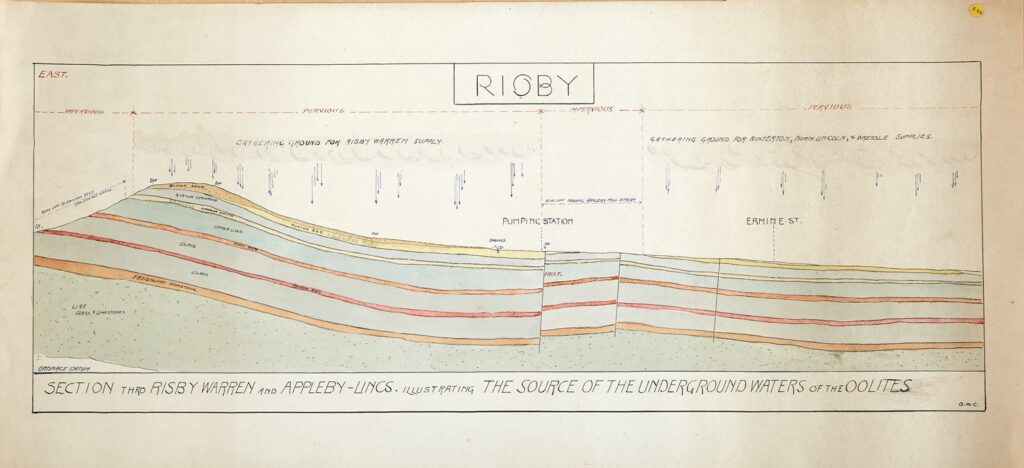
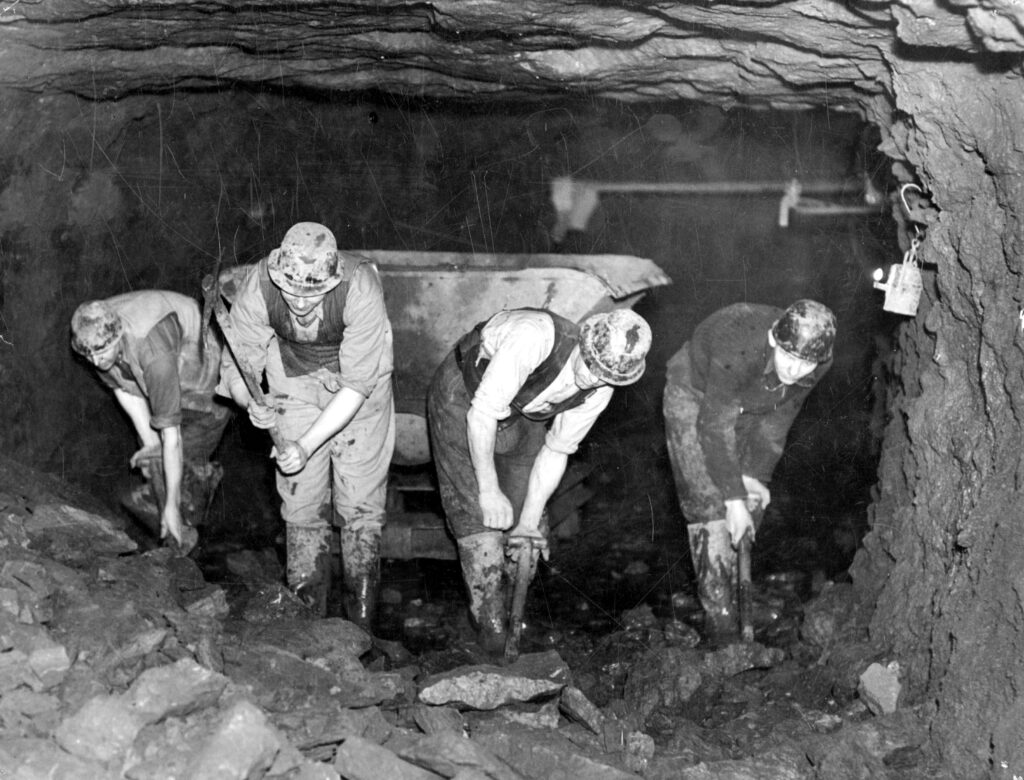
Mapping the geology of Britain became very important during the 19th Century. The industrial revolution relied on coal and other minerals mined from the ground. By understanding where these rocks could be found it made it easier to mine them. In North Lincolnshire, the discovery of ironstone is the reason for the local steel industry.
More to Explore

On The Map Part 1
The first article in a series about the development of the On The Map exhibition.
Read the story
On The Map Part 2
The second article in a series about the development of the On The Map exhibition. A focus on county maps.
Read the story
On The Map Part 3
The third article in a series about the development of the On The Map exhibition. A focus on military maps.
Read the story
On The Map Part 4
The fourth article in a series about the development of the On The Map exhibition. A focus on Medieval mappaemundi.
Read the story